Welcome to Evalys’s documentation!
Evalys - Overview

“Infrastructure Performance Evaluation Toolkit”
It is a data analytics library made to load, compute, and plot data from job scheduling and resource management traces. It allows scientists and engineers to extract useful data and visualize it interactively or in an exported file.
- Free software: BSD license
- Documentation: https://evalys.readthedocs.org.
Features
- Load and all Batsim outputs files
- Compute and plot free slots
- Simple Gantt visualisation
- Compute utilisation / queue
- Compute fragmentation
- Plot energy and machine state
- Load SWF workload files from Parallel Workloads Archive
- Compute standard scheduling metrics
- Show job details
- Extract periods with a given mean utilisation
Examples
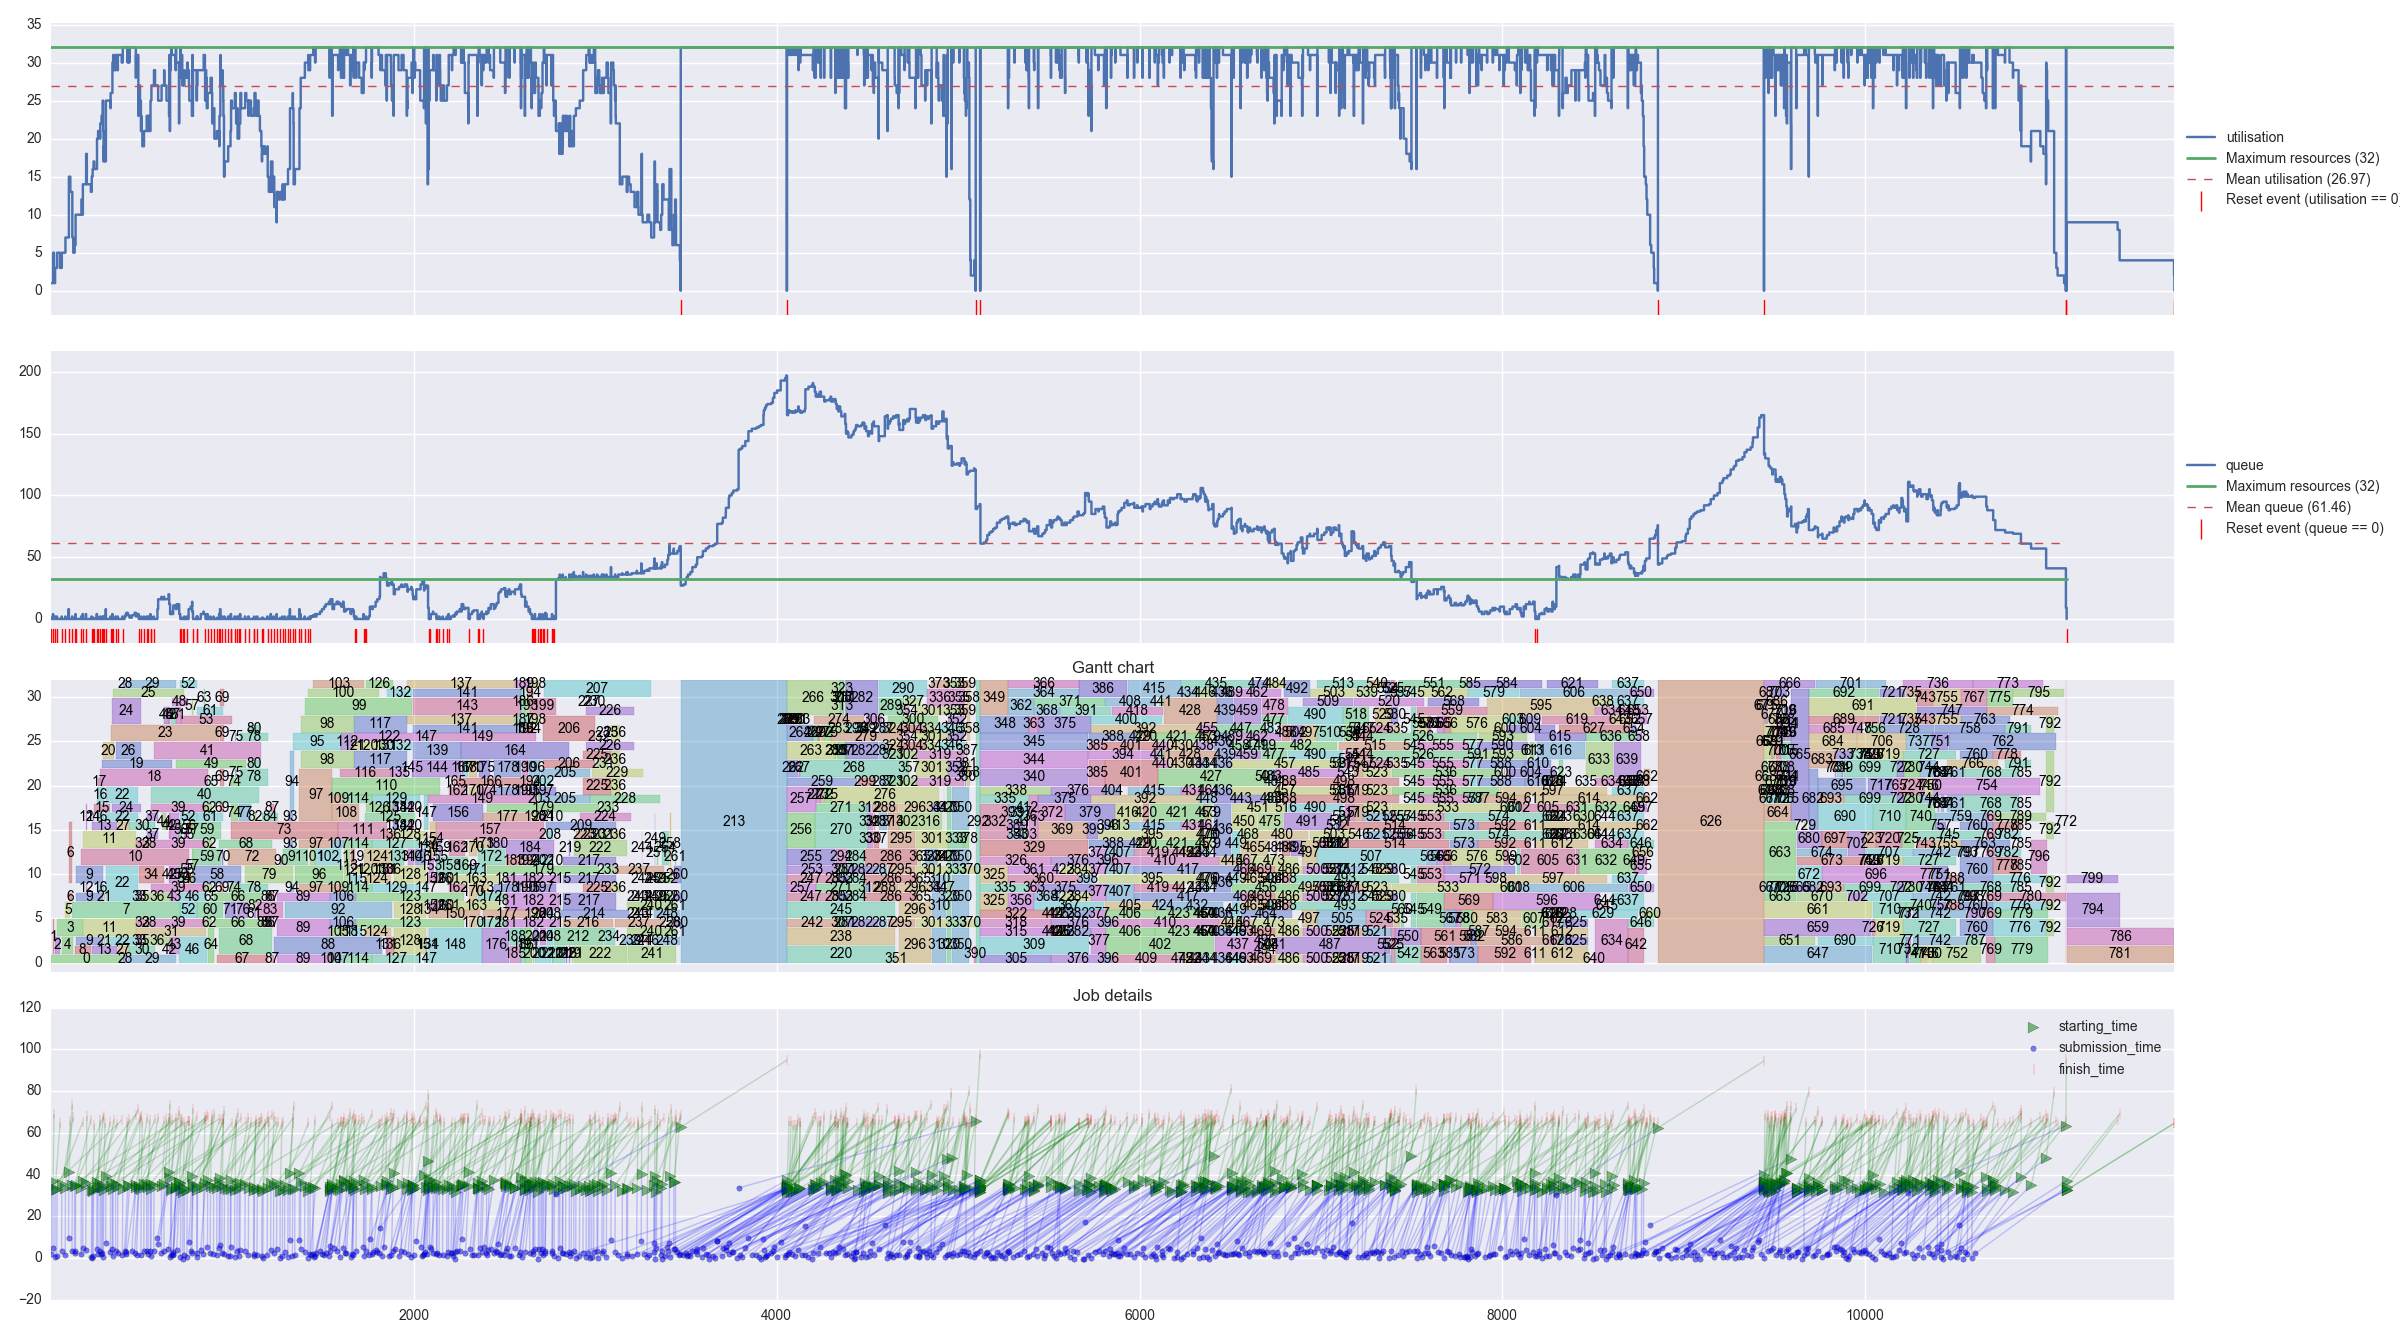
You can get a simple example directly by running ipython and discover the evalys interface. For example:
from evalys.jobset import JobSet
import matplotlib.pyplot as plt

js = JobSet.from_csv("evalys/examples/jobs.csv")
js.plot(with_details=True)
plt.show()
This also works for SWF files but the Gantt chart is not provided because job placement information is not provided in this format.
You can find a lot of examples in the ./examples directory.